McGill
Frustrated Magnets Group
µSR Page
We are currently using µSR to study the static and dynamic behaviour
of magnetic order in partially frustrated magnetic materials.
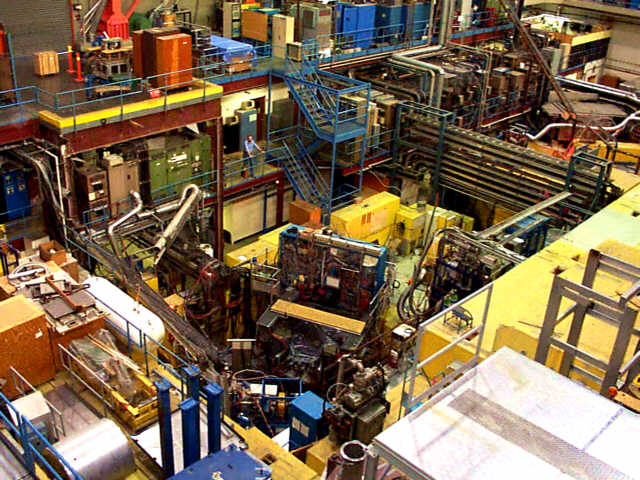
The experimental work takes place in the Meson Hall
at TRIUMF in Vancouver, BC.
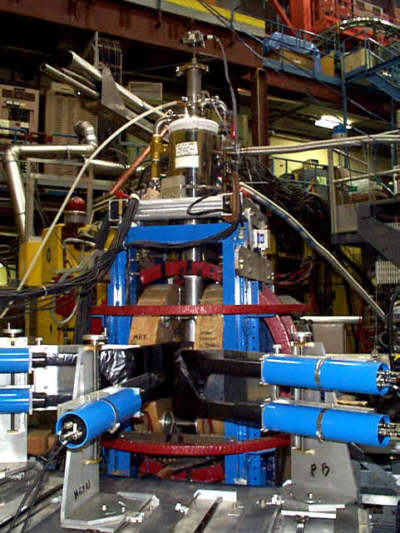 |
µ+ are produced through the decay of pi+
created by proton bombardment of a graphite target. They are collected
and implanted into our sample.
The subsequent decay positron (e+) is detected in one of
four scintillation counters placed in the forward, backward, left and
right directions relative to the incoming beam.
The forward and backward detectors are visible at the left and
right of the picture (pairs of cylinders attached to the black plates).
The (similar) muon arrival detector is also visible at the lower left.
The central structure is the cryostat containing our sample, and surrounded
by (red) Helmholtz coils to control the magnetic field at the sample.
|
We have made measurements using two different beam-lines.
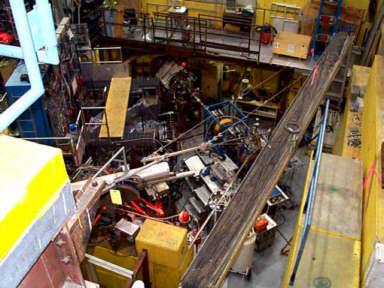
M13 |
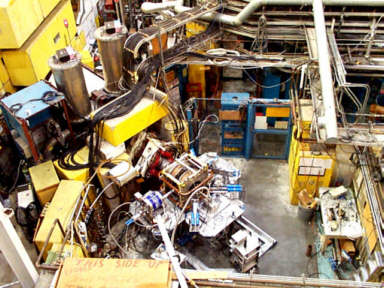
M20 |
Data collection

The actual data-taking process is of course an extremely complex
process that can only be undertaken by highly-trained µSR specialists.
The intense concentration required is demonstrated here by Prof. J.M. Cadogan
(UNSW) and J. van Lierop (McGill).
Introduction
Muons can be used to probe magnetic order because:
(i) they have a magnetic moment
(ii) the positron produced when the muon decays is emitted preferentially
in the direction that the muon moment is pointing.
By implanting muons with a known initial moment direction (the surface
muon beam at TRIUMF is almost 100% polarised with the muon moments pointing
anti-parallel to the flight direction i.e. backwards) and measuring the ratio
between positrons detected in the forward and backward directions (the `asymmetry')
as a function of time, changes in the muon moment direction can be observed.
Raw data for silver in a field of 4 mT
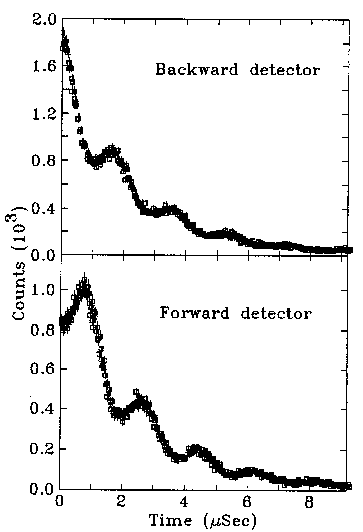
The strongest time dependence comes from the 2.2µs lifetime of the muon, however
the data also show an oscillating component. Comparing the upper and lower panels reveals
that when the forward detector shows a maximum, the backward detector has a minimum.
The muons are precessing in the 4 mT vertical field and the decay positrons form a beam
that turns with them.
Asymmetry data for silver in a field of 4 mT
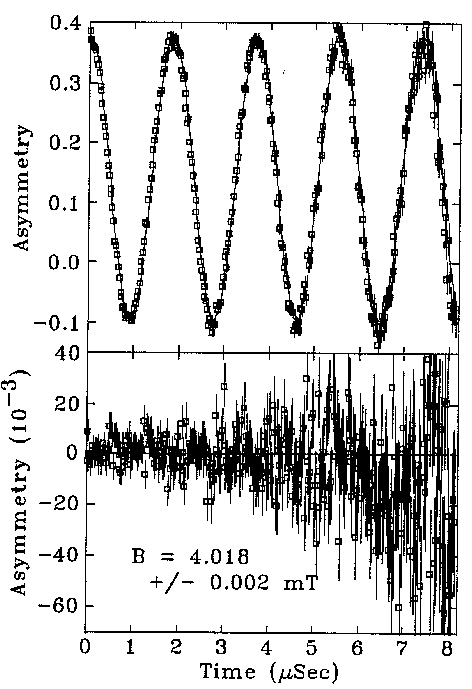 By calculating the asymmetry (F-B)/(F+B) the exponential decay of the muons can
be scaled out, leaving only the precession. The period of the sinusoidal variation
can be determined by fitting, and knowing the gyromagnetic ratio (135 MHz/T)
the field experienced by the muons can be calculated.
Application to the study of transverse spin freezing in partially
frustrated ferromagnets.
While the detailed situation in the samples we are studying is more complex, the
underlying behaviour is unchanged. Our samples are both structurally and magnetically
disordered, so rather than seeing a single unique field, the implanted muons are
subject to fields that are distributed in both magnitude and direction. This washes
out the simple precession seen above in silver and leads to a form with a single
minimum. The position of this minimum is related to the average field at the muon
implantation sites. A typical curve is shown in the inset below.
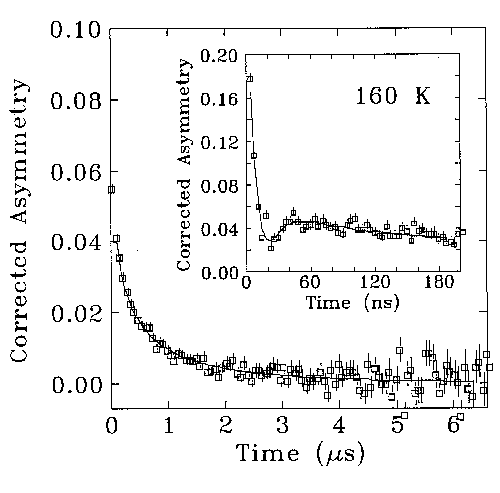 If the muons are also subjected to magnetic fields that vary in time, then the
muon moment directions will be randomised at a rate that depends on these field
fluctuations. An exponential decay in the asymmetry is observed (see main picture
above).
For our purposes, muons provide two main advantages:
(i) The measurements are made with no externally applied field that might
modify the magnetic properties
(ii) Static and time-dependent phenomena are fully distinguished in the data.
This last point can be confirmed by looking at the picture shown above.
The static minumum (inset) occurs around 40 ns, while the exponential decay due
to the dynamics has a time constant of order 1 µs, giving us a factor of
20 separation between the two time scales.
Static |
Dynamic |
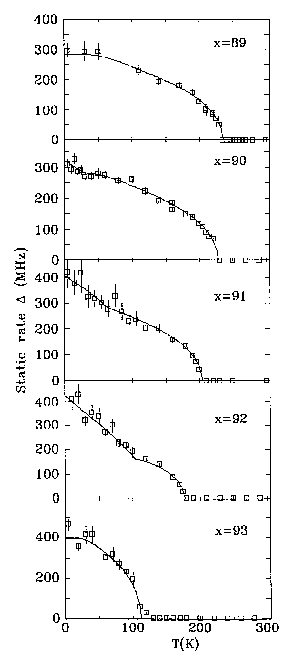
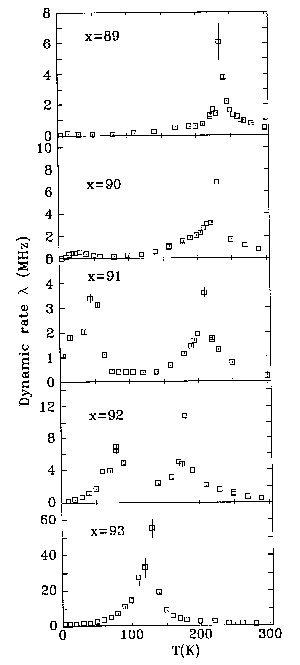
The data shown above for a-FexZr100-x demonstrate
the power of µSR. Two magnetic transitions are clearly seen. On cooling
from 300 K, the static signal (left panel) is zero until Tc is reached,
then static magnetic order develops and the signal strengthens on further cooling.
For x=90, 91 and 92, there is a break in the temperature dependence, with a marked
increase occuring at a reasonably well-defined temperature. The dynamics (right panel)
also reflect this behaviour. On cooling through Tc, the relaxation rate
diverges. Below Tc, the relaxation slows as the static order develops.
However for x=90, 91 and 92, we see a second maximum at the same temperature that the
break in slope of the static order was observed.
Magnetic phase diagram for a-FexZr100-x
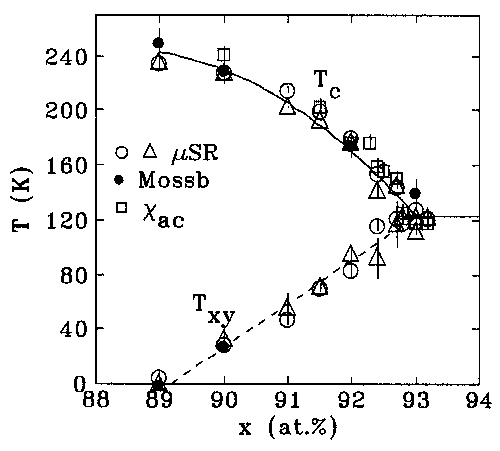
A complete analysis of the data is summarised above as a magnetic phase diagram.
The correspondance in Tc values determined from both static and dynamic
µSR and also from more conventional methods confirms the validity
of the approach. The similarly close correspondance between static and dynamic determinations
of the second transition (Txy) confirms that a single transition occurs
as expected from earlier experimental and theoretical work.
The analysis also reveals that the entire volume of the sample is involved in
both transitions, and that there are no isolated or superparamagnetic clusters
present.
The high density of points around x=93 was used to determine that the critical
concentration for the loss of ferromagnetic order in this system is
x = 92.8 ± 0.1 at.%. No evidence for ``re-entrance'' (development and
subsequent loss of a long-range-ordered state on cooling) was found in this,
or any other system we have studied.
Comparison with Selective Excitation Double Mössbauer Spectroscopy
(SEDM)
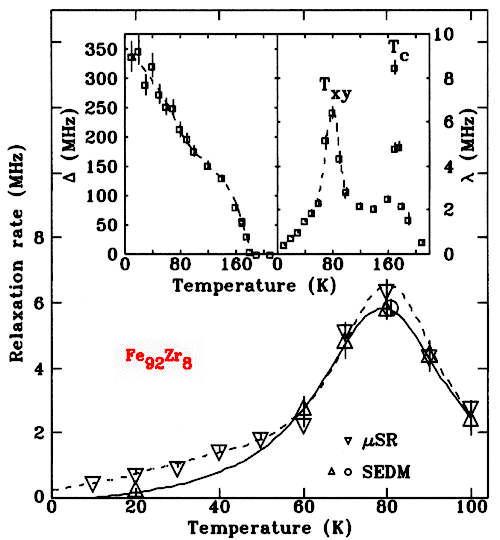
Relaxation rates derived from µSR and SEDM
around Txy for a-Fe92Zr8.
Insets show the static (left) and dynamic (right) signals derived
from µSR for both Tc and Txy.
The comparison between SEDM and µSR is particularly instructive.
µSR is an interstitial probe that is affected by any
fluctuations in its magnetic environment. By contrast,
SEDM probes the behaviour of the iron moments directly, and
is dominated by moment reversals. The almost perfect agreement
in derived relaxation rates around Txy indicates
that moment reversals are the dominant relaxation mechanism.
Field induced shift of Txy
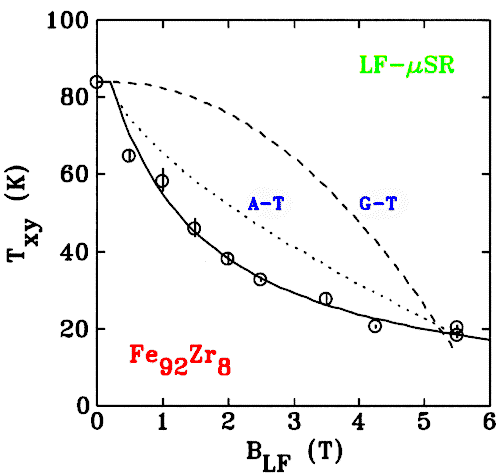
The effect of an externally applied magnetic field on Txy
is shown here along with the predictions of two theoretical models
(A-T and G-T). The gross mis-match between theory and reality is
readily apparent.
Our early work on transverse spin freezing was carried out using
Mössbauer Spectroscopy in an applied field. Comparison with
µSR data showed that the Mössbauer derived transition
temperatures were too low. We therefore repeated the µSR
measurements with a longitudinal magnetic field applied to the
sample and showed that it rapidly suppresses the transition.
As the figure above shows, the functional form of this suppression
is not consistent with mean-field models of spin glasses. We are
currently using numerical modelling to invistigate this effect.
a-(Fe1-xMnx)78Si8B14:
a site-frustrated system.
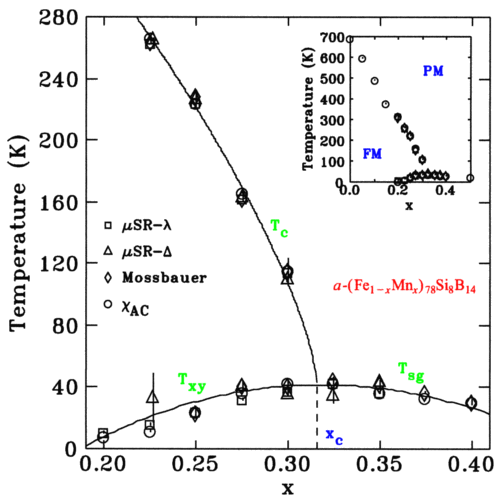
The magnetic phase diagram for
a-(Fe1-xMnx)78Si8B14
derived from
bulk magnetic measurements and also from both µSR Mössbauer Spectroscopy
Inset shows full range of behaviour.
Following suggestions in the literature that this site-frustrated material
exhibited two distinct transitions below Tc, we applied several
techniques that probed both static order and dynamic fluctuations
on a wide range of time scales. As the phase diagram clearly shows, all of
the techniques agree within experimental error. There is only one transition
below Tc, and this transition exhibits the same signatures observed
at Txy in the bond frustrated a-FexZr100-x
system. All static and dynamic signatures coincide.
For more details of these projects, see my recent publications page.
Some useful µSR web links:
Updated: 9/May/03
All photographs copyrighted by:
Dominic Ryan, ERP 425, (514) 398-6534


