iris: ultrafast electron scattering data exploration
Click here to read the documentation
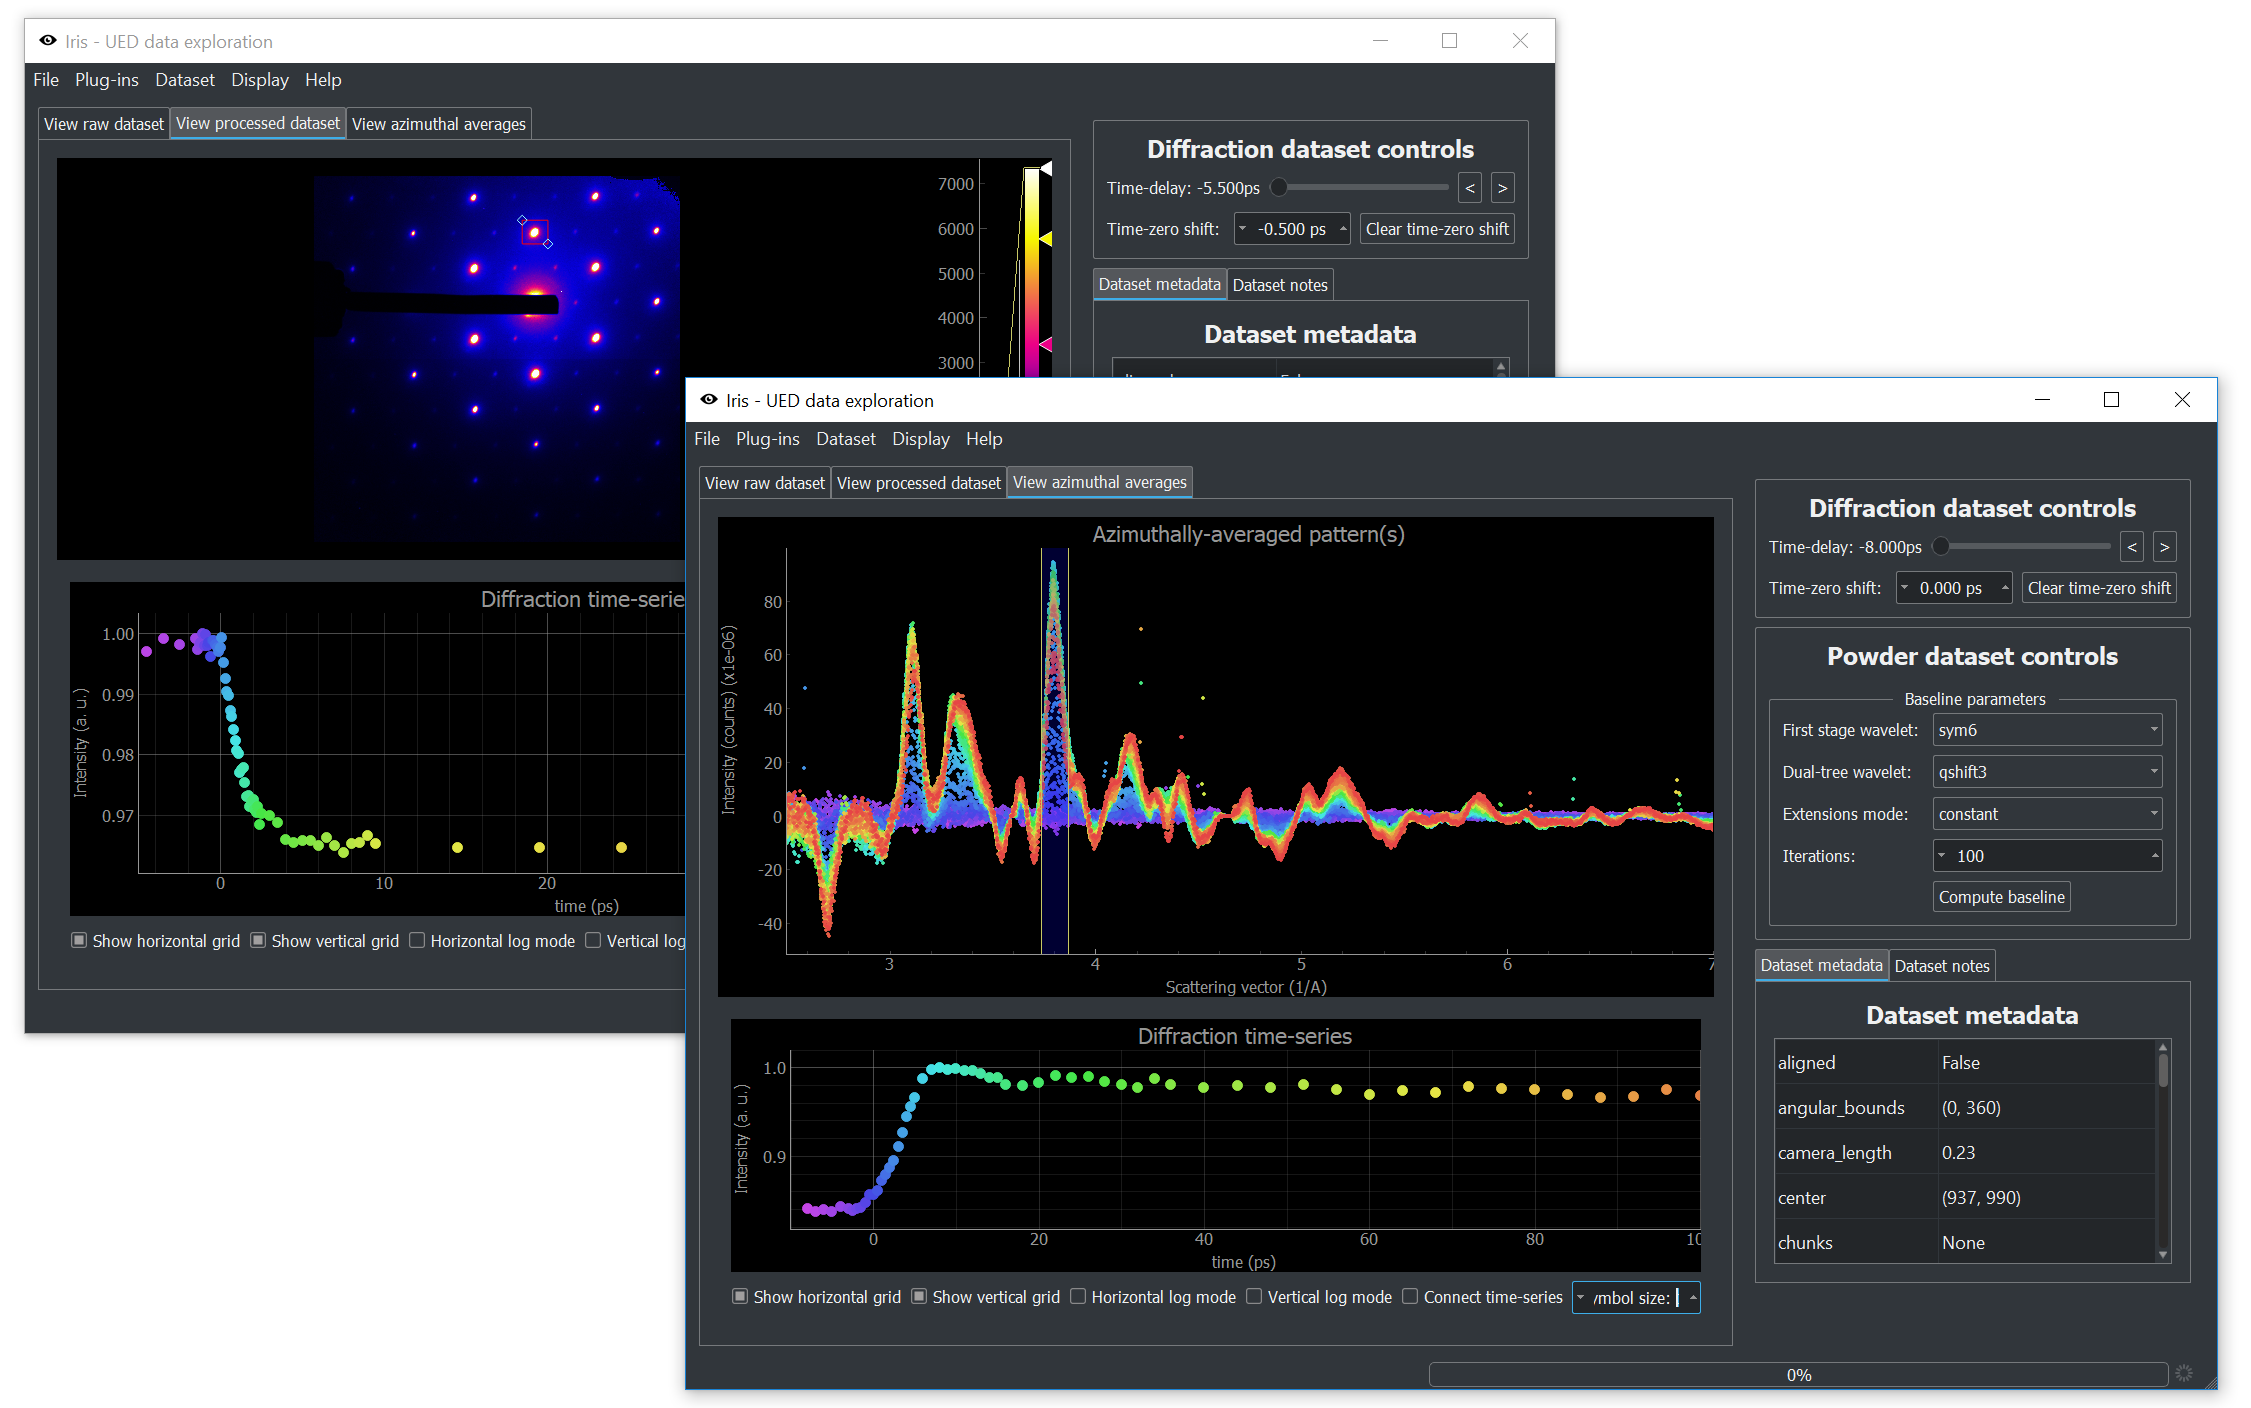
iris is both a Python library for interacting with ultrafast electron diffraction data, as well as a GUI frontend for exploring the data. iris combines scikit-ued and npstreams for (parallel) processing of raw diffraction data.

Ultrafast electron diffractometer generates huge amounts of data in the forms of image stacks. While processing this data is generally straightforward, the sheer size of datasets is always a problem. Even once the data is combined into a single time-series of images, we are still looking at multiple gigabytes of data.
iris allows us to interactively look at this data by slicing diffraction patterns (and powder patterns) through time. Making use of our baseline-removal routine [1] based on the dual-tree complex wavelet transform, we can look at publication-quality data minutes after data collection is complete. While each new experiment ultimately requires different tools, our investigations always start with iris.
Starting with iris 5.1.0, Windows standalone installers are now available!. This will install iris as a standalone program, completely independent from other Python installations on your system. This way should be preferred for those who do not need to interact with data outside of iris. Standalone installers are available on the GitHub releases page.
The latest version of iris includes a plug-in manager. You can write your own plug-in to interact with raw, unprocessed ultrafast electron diffraction data and explore it. To interact with iris datasets in Python script, the iris-ued package must be installed. One of the ways to install is through pip:
$ python -m pip install iris-uediris is also available on the conda-forge channel:
$ conda install -c conda-forge iris-ued Once installed, the package can be used interactively with import iris, or the GUI can be launched with
$ python -m irisTest reduced datasets are made available by the Siwick research group. The data can be accessed on the public data repository.
- L. P. René de Cotret and B. J. Siwick, A general method for baseline-removal in ultrafast electron powder diffraction data using the dual-tree complex wavelet transform, Struct. Dyn. 4 (2017). DOI: 10.1063/1.4972518
- L. P. René de Cotret, M. R. Otto, M. J. Stern, and B. J. Siwick, An open-source software ecosystem for the interactive exploration of ultrafast electron scattering data, Advanced Structural and Chemical Imaging 4:11 (2018). DOI: 10.1186/s40679-018-0060-y
scikit-ued: routines and algorithms for ultrafast electron scattering
Click here to read the documentation
scikit-ued is a fully-tested Python package containing routines and algorithms related to (ultrafast) electron diffraction. The package aims to provide software to deal with simulation, structure manipulation, image-analysis, and baseline-determination. All code in this package is/has been used by the members of the Siwick research group. The package is available on PyPi. To install scikit-ued using pip:
$ python -m pip install scikit-uedAlternatively, you can install scikit-ued through the conda package manager, in the conda-forge channel:
$ conda install -c conda-forge scikit-uedExample: baseline-determination

Baseline signals from inelastic scattering and diffraction from substrates can obscure dynamics of ultrafast electron powder diffraction data. Fourier methods fail in separating the baseline from the elastic (Bragg) scattering signals due to the overlap between diffraction peaks and background. An iterative approach introduced by [2] was the first step in the right direction, but the performance of the real-valued discrete wavelet transform (DWT) proved lackluster in some cases. The dualtree package provides an extension of the algorithm presented in [2] to the use of the dual-tree complex wavelet transform (DTCWT) [3], which presents several advantages over the DWT at a small cost in computational complexity.
Baseline-removal based on the DTCWT has improved the effective signal-to-noise ratio of our instrument, as well as enabled automated data processing. This algorithm can be used without specifying any background-only regions, which are rare occurences in all but trivial structures.
Example: image-alignment
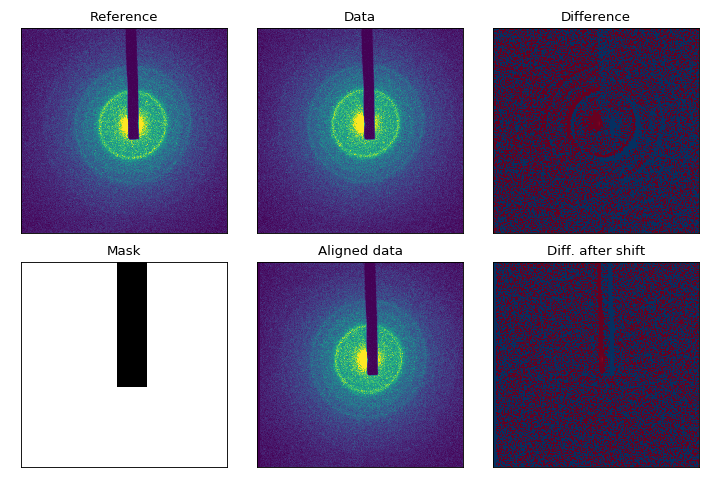
Pointing drift of the probe beam results in diffraction images that are translated with respect to one another. This misalignment must be corrected for similar images to be combined or compared. Contrary to widely-used cross-correlation techniques (available in scikit-image), the alignment procedure in scikit-ued allows for pixel masking for much better results, thanks to recent work by Dirk Padfield [5].
The alignment procedure shown in the figure to the side has been tweaked for low memory usage. A streaming version is also available in scikit-ued, which allows for parallel alignment of multiple datasets.

- L. P. René de Cotret and B. J. Siwick, A general method for baseline-removal in ultrafast electron powder diffraction data using the dual-tree complex wavelet transform, Struct. Dyn. 4 (2017). DOI: 10.1063/1.4972518
- C. M. Galloway, E. C. Le Ru and P. G. Etchegoin, An iterative algorithm for background removal in spectroscopy by wavelet transforms, Applied Spectroscopy 63 (2009)
- N. Kingsbury, The dual-tree complex wavelet transform: a new technique for shift invariance and directional filters, Proc. 8th IEEE DSP Workshop Utah (1998)
- L. P. René de Cotret, M. R. Otto, M. J. Stern, and B. J. Siwick, An open-source software ecosystem for the interactive exploration of ultrafast electron scattering data, Advanced Structural and Chemical Imaging 4:11 (2018). DOI: 10.1186/s40679-018-0060-y
- Dirk Padfield. Masked Object Registration in the Fourier Domain, IEEE Transactions on Image Processing, vol. 21 (5), pp. 2706-2718 (2012)
crystals: data structures to represent abstract crystals
Click here to read the documentation
crystals is an open-source Python package that makes it easy to handle crystal structures. You can easily parse crystal structure files (CIF, PDB, etc.), download structures from crystallography databases, and determine crystal symmetries. Here is quick example of the information you can extract from a Crystallography Information File (CIF):
>>> from crystals import Crystal
>>>
>>> vo2 = Crystal.from_cif('vo2-m1')
>>> vo2
< Crystal object with following unit cell:
    Atom O  @ (0.90, 0.71, 0.30)
    Atom O  @ (0.90, 0.79, 0.80)
    Atom O  @ (0.39, 0.69, 0.29)
    Atom O  @ (0.39, 0.81, 0.79)
    Atom O  @ (0.61, 0.19, 0.21)
    Atom O  @ (0.61, 0.31, 0.71)
    Atom O  @ (0.10, 0.21, 0.20)
    Atom O  @ (0.10, 0.29, 0.70)
    Atom V  @ (0.76, 0.03, 0.97)
    Atom V  @ (0.76, 0.48, 0.47)
    Atom V  @ (0.24, 0.53, 0.53)
    Atom V  @ (0.24, 0.97, 0.03)
Lattice parameters:
    a=5.743Å, b=4.517Å, c=5.375Å
    α=90.000°, β=122.600°, γ=90.000°
Chemical composition:
    O: 66.667%
    V: 33.333%
Source:
    (...omitted...)\vo2-m1.cif >
Here is another example: determine crystal symmetries via SPGLIB:
>>> vo2.symmetry()
{'centering': <CenteringType.primitive: 'P'>,
 'hall_number': 81,
 'hall_symbol': '-P 2ybc',
 'hm_symbol': 'P121/c1',
 'international_full': 'P 1 2_1/c 1',
 'international_number': 14,
 'international_symbol': 'P2_1/c',
 'pointgroup': 'C2h'
 }
To install crystals using pip:
$ pip install crystalsAlternatively, you can install crystals through the conda package manager, in the conda-forge channel:
$ conda install -c conda-forge crystalsL. P. René de Cotret, M. R. Otto, M. J. Stern, and B. J. Siwick, An open-source software ecosystem for the interactive exploration of ultrafast electron scattering data, Advanced Structural and Chemical Imaging 4:11 (2018). DOI: 10.1186/s40679-018-0060-y
A. Togo and I. Tanaka, Spglib: a software library for crystal symmetry search. ArXiv 2018
npstreams: streaming operations on NumPy arrays
Click here to read the documentation
npstreams is an open-source Python package for streaming NumPy array operations. The goal is to provide tested routines that operate on streams of arrays instead of dense arrays. It is the secret sauce that powers iris’s high-performance, highly-parallel data reduction pipeline. To install npstreams using pip:
$ pip install npstreamsAlternatively, you can install npstreams through the conda package manager, in the conda-forge channel:
$ conda install -c conda-forge npstreamsStreaming reduction operations (sums, averages, etc.) can be implemented in constant memory, which in turns allows for easy parallelization. Some routines in scikit-ued are parallelized in this way. In our experience, this approach has resulted in huge speedups when working with images; the images are read one-by-one from disk and combined/processed in a streaming fashion, in parallel.
- L. P. René de Cotret, M. R. Otto, M. J. Stern, and B. J. Siwick, An open-source software ecosystem for the interactive exploration of ultrafast electron scattering data, Advanced Structural and Chemical Imaging 4:11 (2018). DOI: 10.1186/s40679-018-0060-y
dtgui: graphical user-interface for interactive baseline-subtraction

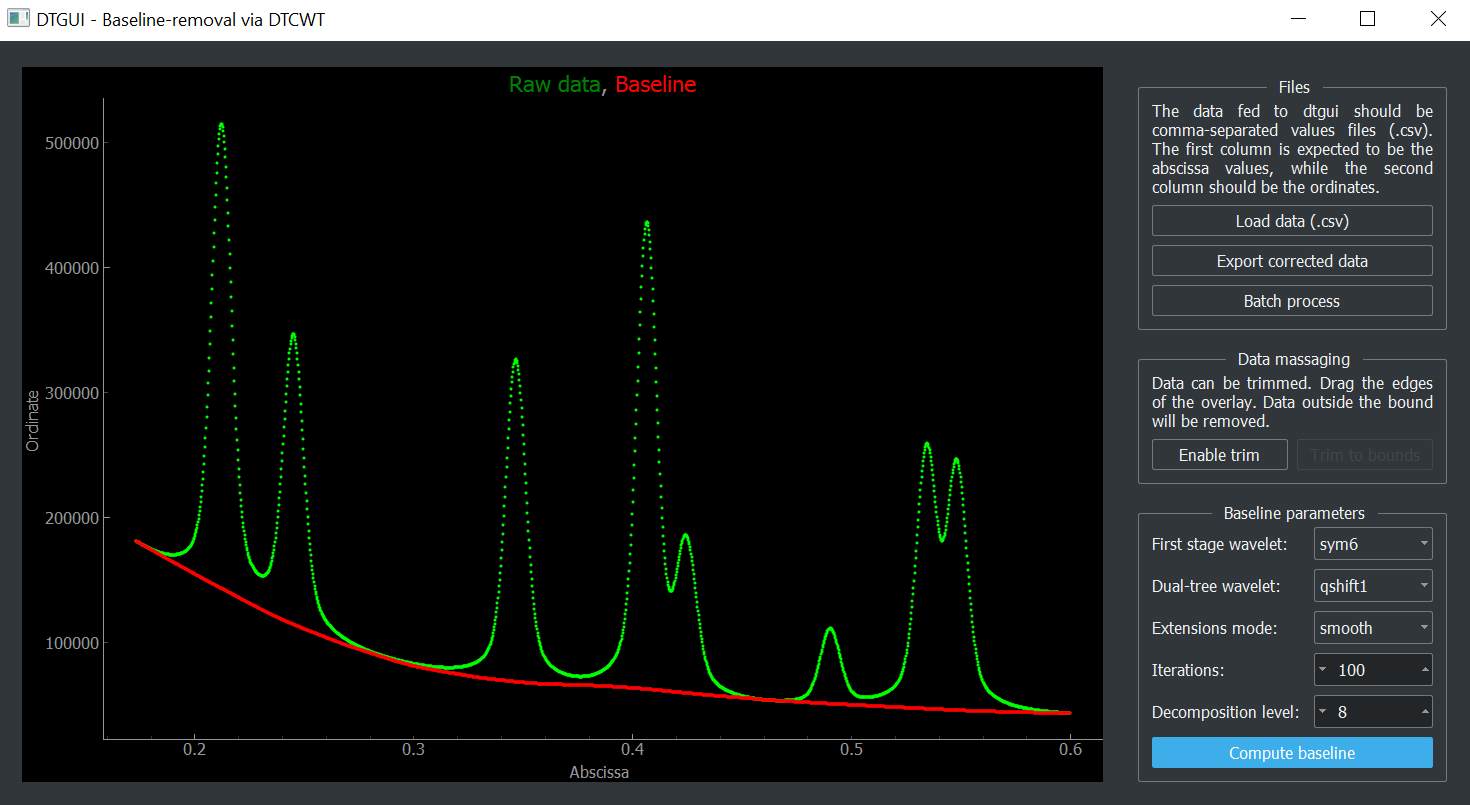
dtgui is a simple graphical user interface (GUI) to test our baseline-subtraction algorithm [1] on simple columnar data. The package is installable from PyPi:
$ python -m pip install dtgui dtgui is meant for quick testing and exploring the parameter space. For full control over baseline-correction, check out the documentation for the scikit-ued implementation.
- L. P. René de Cotret and B. J. Siwick, A general method for baseline-removal in ultrafast electron powder diffraction data using the dual-tree complex wavelet transform, Struct. Dyn. 4 (2017). DOI: 10.1063/1.4972518
- L. P. René de Cotret, M. R. Otto, M. J. Stern, and B. J. Siwick, An open-source software ecosystem for the interactive exploration of ultrafast electron scattering data, Advanced Structural and Chemical Imaging 4:11 (2018). DOI: 10.1186/s40679-018-0060-y
gms-socket-plugin: TCP/IP socket plug-in for Gatan Microscopy Suite 3+
gms-socket-plugin is a Gatan Microscopy Suite plug-in exposing a few functions to DigitalMicrograph scripts for TCP/IP communication. Take a look at the online repository for documentation.
